You want to invest in the market, come across different assets, and have little understanding of price metrics. But you are not sure what you are thinking is right or wrong.
You check the screener website and see that the current stock price is ₹240, and then you start to think if ₹240 is a reasonable amount for the stock?
You started looking on the web for some idea about “how to value stocks”? And you came across the concept of valuation and pricing.
Pricing: How Much Are You Willing To Pay
Pricing is the amount you see on the label of a product, let’s say a football match ticket. It is driven by demand and supply. If, as a buyer, I am ready to pay $100 for the ticket, why would the seller sell it at $90? In simple terms, it’s a demand-and-supply game. Another example could be real estate properties, which are primarily driven by the demand for the property.
How Pricing Works In Stock
As we see that pricing is nothing but the current price, in the case of the stock market, it will be the current price of the stock. But how will you evaluate the price if the price is actually close to the demand?
In the pricing of stocks, we use different ratios to evaluate the question at hand. And the next part will sound very familiar to you, as we will analyse the different types of ratios.
- P/E Ratio: One of the most used pricing ratios to evaluate the price, it basically tells you “how much you are willing to pay the company for 1 unit of earnings. The key to judging the ratio is that the lower the P/E ratio, the better.
- EV/EBITDA: It evaluates the enterprise value (EV) relative to Earnings Before Interest, Taxes, and Depreciation (EBITDA). The higher the number, the better.
- P/S Ratio: Similar to P/E ratios, but instead of earnings, we use sales/revenue data. Again, the thumb rule is, the lower the better.
- P/B Ratio: Price-to-book ratio tells you about how much you are paying per unit of book value(Book value = Current assets – Current liabilities).
- PEG Ratio: The PEG ratio is the modified version of the P/E ratio, as it includes a growth component in the earnings. Its formula is the P/E ratio divided by the growth rate. Investors believe this ratio is a better judgment tool as it incorporates growth.
- Dividend Yield: It simply tells you how much you are earning from the dividend based on the current price of the stock. The higher the dividend yield, the better.

Now, the main questions are whether these ratios are beneficial and, if so, for whom and for what types of securities.
As narrated earlier, pricing is based on demand and supply, so any asset with more demand than supply tends to be more expensive.
Assets like gold, crude oil, real estate, and movie tickets are all driven by supply and demand, and hence, they should be priced better.
In case of any stocks, you have to ask yourself if you are okay paying what others are paying for the company, and that’s where we use pricing ratios as a comparison metric.
Let’s say company A, a defence company, has a current stock price of ₹200 and EPS of 5. From the above formula, we can P/E of the A is 40, and there is another company B in the same industry that has a P/E of 30. Logically, if you buy A, you are paying the company ₹40 to generate ₹1 of earnings, while for B, it is 30, so B looks cheaper than A.
That’s how pricing works: it is always compared with very similar assets, and a decision is made on whether it is overpriced or underpriced.
Now comes one more question: how is pricing different from valuation? Now, to answer this question, we need to understand what valuation is.
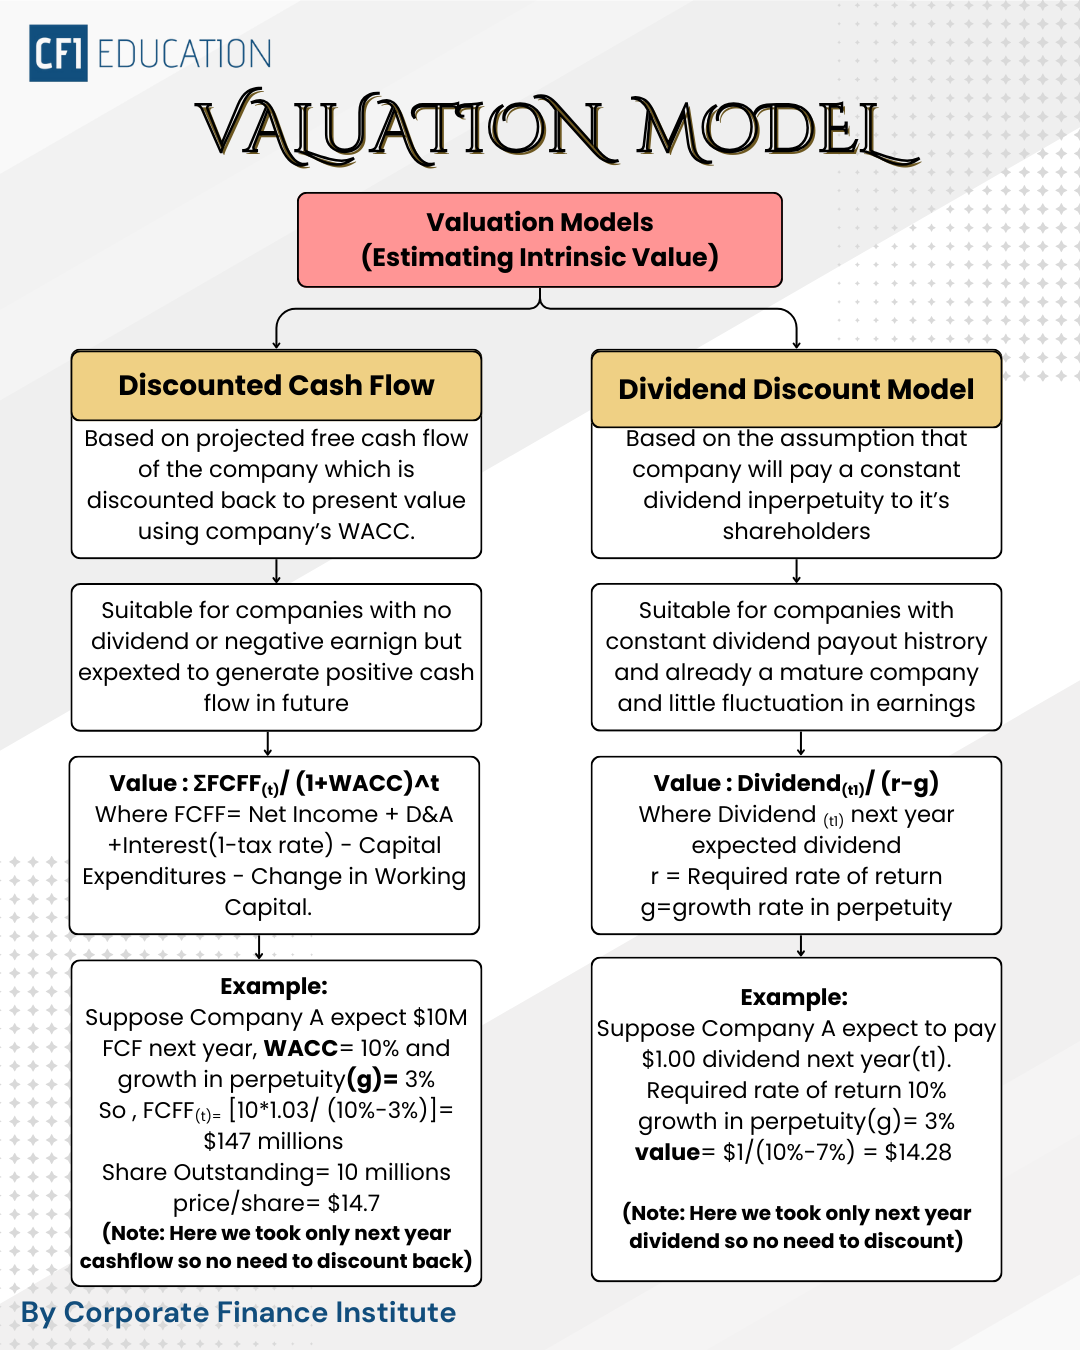
In simple terms, valuation refers to the real intrinsic value of the business, which can be attributed to the company’s free cash flow or dividend policy. And I will talk about two broadly used valuation methods, the first is the dividend discount model, free cash flow valuation(also known as discounted cash flow, DCF)
Dividend Discount Model
As the name suggests, this valuation method uses dividends as a primary number to calculate the value of the business, and the simple assumption here is that the company will continue to pay dividends in perpetuity.
Now, the dividend discount model (DDM) is commonly used for mature and old companies because they are steady businesses and are expected to continue to pay dividends. You may ask why not for young growing companies, the simple answer is that young companies, early in their phase, usually report negative earnings and do not pay dividends. Even if some companies have positive earnings, they mostly use the retained earnings to invest in projects that further generate positive cash flow and thus don’t pay dividends at that time.
DDM Formula & Example
Before we see the formula and example, let’s look at the main terms and their meaning.
- Dividend: A dividend is the cash a company pays to its shareholders, usually quarterly or annually.
Example:
If a company pays $2 per share per year, that’s its dividend.
- Dividend Per Share (D₀ & D₁):
D₀ (Current Dividend): The dividend the company has just paid.
D₁ (Next Year’s Dividend): The dividend expected next year.
- Dividend Growth Rate (g): The expected rate at which dividends will increase each year.
Examples:
If a company’s dividend rises from $2 to $2.10 next year → growth of 5%
High-growth firms may have g = 8–12%
Mature companies may have g = 2–4%
- Required Rate of Return: This is the return you expect for taking the risk of investing in the stock.
It depends on:
Risk of the company
Market conditions
Your opportunity cost
Example: If similar risk investments give a 10% return, your required return = 10%.
- Present Value (PV) Concept: Money in the future is worth less than money today.
So future dividends must be discounted back to today’s value.
DDM Formula (Gordon Growth Model)
Value of stock = next year’s dividend ÷ (required return − growth rate)

Example
A company:
- Just paid dividend D₀ = $2
- Dividend growth rate g = 5%
- Required return r = 10%
Step 1: Calculate next year’s dividend (D₁)
D1=2×(1.05)=2.10
Step 2: Apply the DDM formula
Intrinsic Value =2.10 / (0.10-0.05) = $42
Step 3: Final Interpretation
Intrinsic Value = $42
If market price is below $42 → Buy (undervalued)
If the market price is above $42 → Avoid (overvalued)
This was the broader framework of the DDM model and also the very basic one. There are many modified versions of DDM, such as a two-stage DDM model, where the company at the beginning grows at a higher pace, followed by a constant growth rate, and we can also have a three-stage DDM model, where there are three different growth phases.
Now, let’s dive into discounted cash flow methods, usually known as the DCF model.
Discounted Cash Flow Valuation
DCF can get tricky because it includes a lot of technicalities, and it is usually carried out on Excel because of its calculation-intensive nature and interlinking between financial statements. But we will try to make it easy to understand, so you can get a rough idea of how it works and how you can judge the company based on free cash flows.
The very basic idea of the DCF model relies on the company’s free cash flows. Here, cash flow differs from net income: net income can be positive, but that doesn’t necessarily mean free cash flow will be.
Let’s understand basic terms in DCF as we did in DDM.
- Free Cash Flow (FCF): This is the cash a company generates after paying for all expenses, investments and changes in working capital.
The formula is simple, and there are multiple ways to calculate it. We will see the most commonly used one.
FCF: Net Income + Depreciation& Amortization + Interest Expense(I – Tax Rate) – Fixed Capital Investment – Change in Working Capital
- Forecast Period: DCF typically projects cash flows over 5–10 years.
Example:
FCF may grow like:
Year 1 → $100M
Year 2 → $110M
Year 3 → $120M … etc.
- Growth Rate: The rate at which free cash flow grows every year.
Companies grow at:
High growth: 10–20%
Moderate growth: 5–10%
Mature companies: 2–4%
- Weighted Average Cost of Capital(WACC): WACC is the cost of capital for the company. It simply means how much it costs the company to raise funds. It also considers both debt and equity.
- Terminal Value (TV): DCF doesn’t forecast forever. So after 5–10 years, we assume the company grows at a stable long-term rate.
Now that we have a basic understanding of terms, let’s see how DCF works with a simple example.
DCF Model: Full Structure
- Step 1: Forecast future free cash flows (FCF)
- Step 2: Discount each FCF to present value
- Step 3: Calculate terminal value
- Step 4: Discount terminal value
- Step 5: Add everything → Get Enterprise Value
- Step 6: Subtract debt, add cash → Get Equity Value
- Step 7: Divide by shares → Intrinsic Value per Share
Example
A company’s current free cash flow = $100 million
FCF grows at 5% per year for the next 5 years
Discount rate (WACC) = 10%
Long-term growth rate after Year 5 = 3%
| Year | FCF (in $M) |
| 1 | 105 |
| 2 | 110.25 |
| 3 | 115.76 |
| 4 | 121.55 |
| 5 | 127.63 |
Step 2: Discount Each FCF,
PV = FCF/ (1.10)^n
| Year | PV of FCF ($M) |
| 1 | 95.45 |
| 2 | 91.13 |
| 3 | 87.00 |
| 4 | 83.03 |
| 5 | 79.30 |
Total PV of 5-year cash flows = $435.91M
Step 3: Terminal Value (TV)
FCF6= (127.63* 1.03)/ (0.10-0.03) = $1878.06
Step 4: Discount TV
$1878.06/ (1.1)^5 = $1164.33
Step 5: Add all Cashflows and TV
$435.91+$1164.33=$1600.24 million
Now, let’s assume the company has no debt and is not holding any cash at this moment and has 100 million shares outstanding.
Price per stock: $1164.33/ 100 = $11.64.
This is how a basic DCF model works, with cash flows and WACC. Every component of the DCF model tells a story and needs to be understood thoroughly to make your analysis better and more rational. That’s where our Course on Financial Modelling & Valuation Professional (FMVP) comes in handy.
This was a basic DCF model that was just for example; there are a lot more components to it, like DDM, which also includes two-stage DCF or three-stage DCF. DCF models are usually carried out on Excel because of its interlinking nature.
The Bottom Line
Pricing tells you what everyone else is willing to pay. Valuation tells you what the business is truly worth.
Pricing is driven by demand and supply, and you judge it using market ratios like P/E, P/B, EV/EBITDA, etc. Valuation, on the other hand, is rooted in fundamentals—how much cash a business can actually generate through dividends (DDM) or free cash flows (DCF). A smart investor never relies on price solely. They compare the market price with intrinsic value:
If Price < Value → Buy (undervalued)
If Price > Value → Avoid or Sell (overvalued)
In short, Pricing is market psychology. Valuation is a business reality. Master both—and you master investing.


